
Education

Share With Others...
World Energy and Economic Outlook
International Energy Outlook 2008
Report #:DOE/EIA-0484(2008)
Release Date: June 2008
Next Release Date: May 2009
Chapter 1 - World Energy Demand and Economic Outlook
International Energy Outlook 2008
Report #:DOE/EIA-0484(2008)
Release Date: June 2008
Next Release Date: May 2009
Chapter 1 - World Energy Demand and Economic Outlook
|
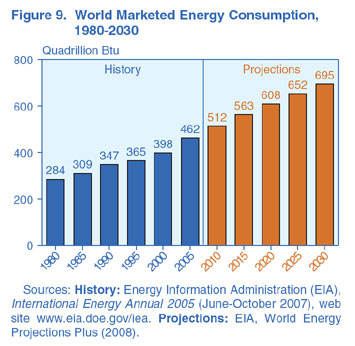
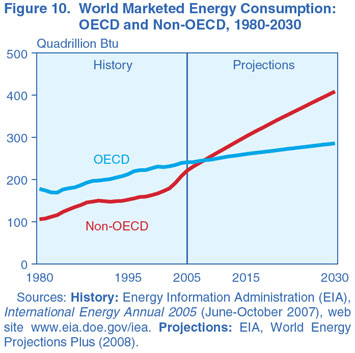
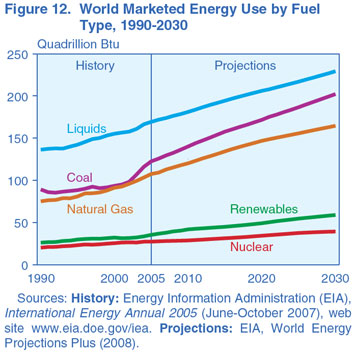
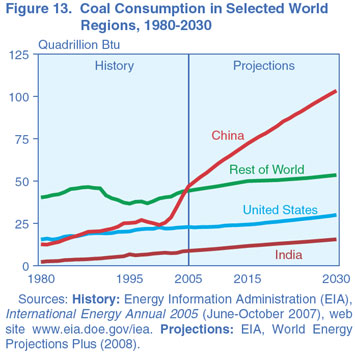
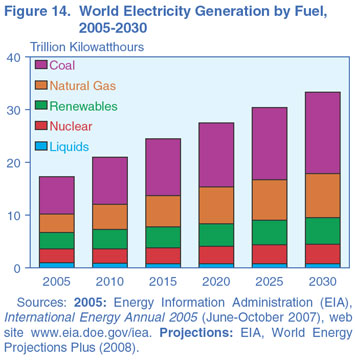
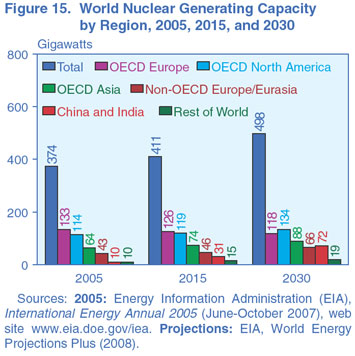
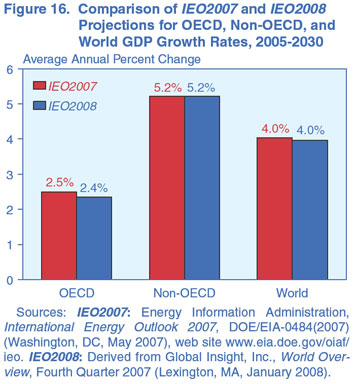
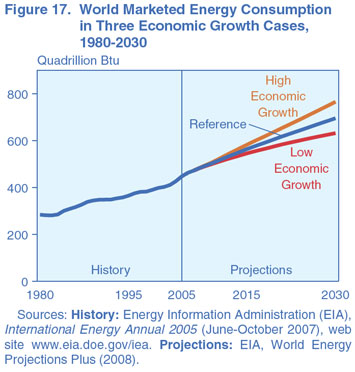
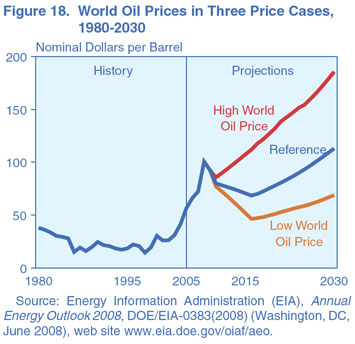
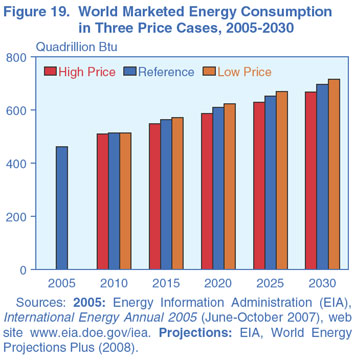
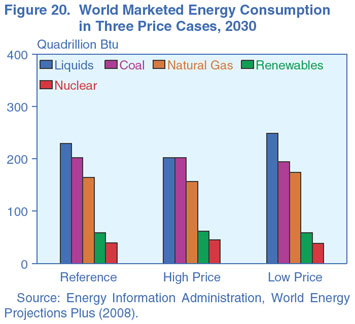
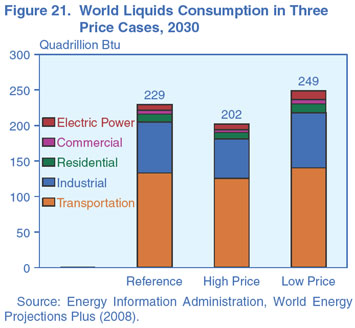
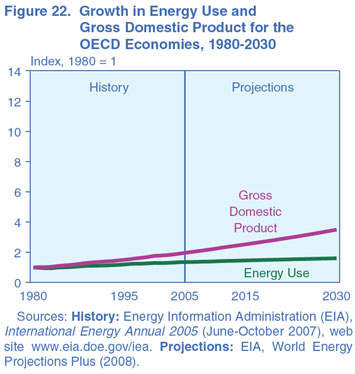
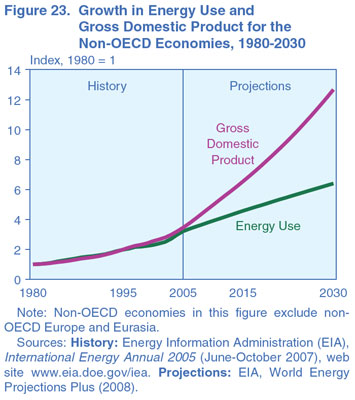
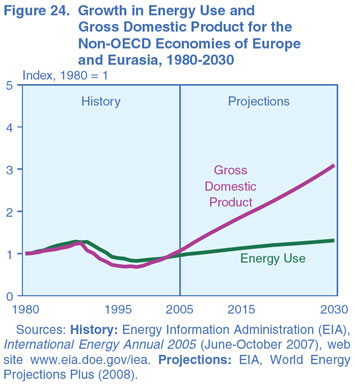
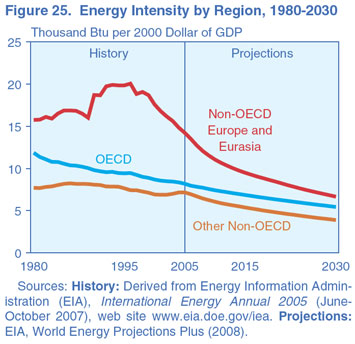
In the IEO2008 projections, total world consumption of marketed energy is projected to increase by 50 percent from 2005 to 2030. The largest projected increase in energy demand is for the non-OECD economies. World energy consumption is projected to expand by 50 percent from 2005 to 2030 in the IEO2008 reference case projection (Figure 9 and Table 1). Although high prices for oil and natural gas, which are expected to continue throughout the period, are likely to slow the growth of energy demand in the long term, world energy consumption is projected to continue increasing strongly as a result of robust economic growth and expanding populations in the world’s developing countries. OECD member countries are, for the most part, more advanced energy consumers.2 Energy demand in the OECD economies is expected to grow slowly over the projection period, at an average annual rate of 0.7 percent, whereas energy consumption in the emerging economies of non-OECD countries is expected to expand by an average of 2.5 percent per year (Figure 10). China and India—the fastest growing non-OECD economies—will be key contributors to world energy consumption in the future. Over the past decades, their energy consumption as a share of total world energy use has increased significantly. In 1980, China and India together accounted for less than 8 percent of the world’s total energy consumption; in 2005 their share had grown to 18 percent. Even stronger growth is projected over the next 25 years, with their combined energy use more than doubling and their share increasing to one-quarter of world energy consumption in 2030 in the IEO2008 reference case. In contrast, the U.S. share of total world energy consumption is projected to contract from 22 percent in 2005 to about 17 percent in 2030. Energy consumption in other non-OECD regions also is expected to grow strongly from 2005 to 2030, with increases of around 60 percent projected for the Middle East, Africa, and Central and South America (Figure 11). A smaller increase, about 36 percent, is expected for non-OECD Europe and Eurasia (including Russia and the other former Soviet Republics), as substantial gains in energy efficiency result from the replacement of inefficient Soviet-era capital stock and population growth rates decline. This chapter presents an overview of the IEO2008 outlook for global marketed energy consumption by energy source and by end-use sector. It includes discussions of the major assumptions that form the basis for the IEO2008 projections, including macroeconomic assumptions for the key OECD and non-OECD economies. As with any set of projections, there is significant uncertainty associated with the IEO2008 energy projections. Two sets of sensitivity cases, which vary some of the assumptions behind the projections, are also examined in this chapter: the high and low macroeconomic growth cases and high and low energy price cases. The sensitivity cases are intended to illustrate alternative scenarios rather than to identify any bounds on uncertainty, which can be affected by policy and technology developments as well as by price and growth paths. Also included is a discussion of the possible effects of future trends in energy intensity (the relationship between energy use and economic growth) on the reference case projections. Outlook for World Energy Consumption by SourceThe use of all energy sources increases over the time frame of the IEO2008 reference case (Figure 12). Given expectations that world oil prices will remain relatively high throughout the projection, liquid fuels3 are the world’s slowest growing source of energy; liquids consumption increases at an average annual rate of 1.2 percent from 2005 to 2030. Renewable energy and coal are the fastest growing energy sources, with consumption increasing by 2.1 percent and 2.0 percent, respectively. Projected high prices for oil and natural gas, as well as rising concern about the environmental impacts of fossil fuel use, improve prospects for renewable energy sources. Coal’s costs are comparatively low relative to the costs of liquids and natural gas, and abundant resources in large energy-consuming countries (including China, India, and the United States) make coal an economical fuel choice. Although liquid fuels and other petroleum are expected to remain important sources of energy throughout the projections, the liquids share of marketed world energy consumption declines from 37 percent in 2005 to 33 percent in 2030 in the reference case as high world oil prices lead many consumers to switch from liquid fuels and other petroleum when feasible. For example, the projections show a steady decline in the use of liquids for electricity generation in all regions of the world except the Middle East. Whereas the IEO2007 reference case projected a 0.4-percent average annual increase in liquids use for electricity generation worldwide from 2005 to 2030, IEO2008 projects an average decrease of 1.0 percent per year. Efficiency gains and fuel substitution slow the growth of liquids consumption in the industrial sector, especially in the non-OECD regions, where there are more opportunities for fuel switching. World liquids consumption for energy in the industrial sector increases by 1.1 percent per year in the IEO2008 reference case. The IEO2008 high price case reflects a price path that is closer, in real terms, to prices prevailing during the first 8 months of 2008. In this case, world liquids consumption increases by an average of only 0.7 percent per year from 2005 to 2030, as compared with 1.2-percent average annual growth in the reference case. In the high price case, the liquids share of total energy consumption falls to 30 percent in 2030. Natural gas remains an important fuel for electricity generation worldwide, because it is more efficient and less carbon intensive than other fossil fuels. In the IEO2008 reference case, total natural gas consumption increases by 1.7 percent per year on average, from 104 trillion cubic feet to 158 trillion cubic feet, while its share of world electricity generation increases from 20 percent in 2005 to 25 percent in 2030. Growth in world demand for natural gas is slower in IEO2008 than was projected in IEO2007, however, primarily because of the smaller increases in natural-gas-fired generating capacity expected for some countries. For example, natural-gas-fired generation in the United States in 2030 is 14 percent lower in IEO2008 than was projected in last year’s outlook. Higher natural gas prices, along with U.S. tax incentives for clean coal technologies, are expected to discourage the construction of new natural-gas-fired plants in favor of coal-fired plants. Coal’s share of world energy use has increased sharply over the past few years, and without significant changes in existing laws and polices, particularly those related to greenhouse gas emissions, robust growth is likely to continue. Coal accounted for 24 percent of total world energy use in 2002 and 27 percent in 2005, largely as a result of rapid increases in coal use in China. After growing at an average rate of 3 percent per year from 1990 to 2001, China’s coal consumption increased by 17 percent per year on average from 2002 to 2005. As a result, coal use in China has nearly doubled since 2000, and given the country’s rapidly expanding economy and large domestic coal deposits, its demand for coal is projected to continue growing strongly. Worldwide, coal consumption is projected to increase by 2.0 percent per year from 2005 to 2030 (by 35 quadrillion Btu from 2005 to 2015 and by another 44 quadrillion Btu from 2015 to 2030) and to account for 29 percent of total world energy consumption in 2030. In the absence of policies or legislation that would limit the growth of coal use, the United States, China, and India are expected to turn to coal in place of more expensive fuels. Together, the three nations account for 90 percent of the projected increase from 2005 to 2030 (Figure 13). The only countries for which decreases in coal consumption are projected are OECD Europe and Japan, where populations are either growing slowly or declining, electricity demand growth is slow, and natural gas, nuclear power, and renewables are likely to be used for electricity generation rather than coal. Net electricity generation worldwide is projected to total 33.3 trillion kilowatthours in 2030, nearly double the 2005 total of 17.3 trillion kilowatthours. The strongest growth in electricity generation is projected for the non-OECD countries. Non-OECD electricity generation increases by 4.0 percent per year in the IEO2008 reference case, as rising standards of living increase demand for home appliances and the expansion of commercial services, including hospitals, office buildings, and shopping malls. In the OECD nations, where infrastructures are well established and population growth is relatively slow, much slower growth in generation is expected, averaging 1.3 percent per year from 2005 to 2030. Natural gas and coal, which currently are the fastest growing fuel sources for electricity generation worldwide, continue to lead the increase in fuel use in the electric power sector in the IEO2008 reference case (Figure 14). The natural gas share increases from 20 percent in 2005 to 25 percent in 2030, and the coal share increases from 41 percent to 46 percent. Because natural gas is an efficient fuel for electric power generation and produces less carbon dioxide than coal or petroleum products, it is an attractive choice in many nations; however, in the United States and non-OECD Asia, where coal resources are ample, higher prices for oil and natural gas make coal a more economical source of energy for electricity generation. Electricity generation from nuclear power increases from 2.6 trillion kilowatthours in 2005 to 3.0 trillion kilowatthours in 2015 and 3.8 trillion kilowatthours in 2030 in the IEO2008 reference case. Concerns about rising fossil fuel prices, energy security, and greenhouse gas emissions support the development of new nuclear generating capacity. Higher capacity utilization rates have been reported for many existing nuclear facilities, and it is anticipated that most of the older plants now operating in OECD countries and in non-OECD Eurasia will be granted extensions to their operating lives. There is still considerable uncertainty about the future of nuclear power, however, and a number of issues could slow the development of new nuclear power plants. Plant safety, radioactive waste disposal, and the proliferation of nuclear weapons, which continue to raise public concerns in many countries, may hinder plans for new installations, and high capital and maintenance costs may keep some countries from expanding their nuclear power programs. Nevertheless, the IEO2008 projection for world nuclear electricity generation in 2025 is 31 percent higher than the projection in IEO2003 just 5 years ago. Most of the expansion of installed nuclear power capacity is expected in non-OECD countries (Figure 15). Russia, China, and India account for almost two-thirds of the projected net increment in world nuclear power capacity between 2005 and 2030. In the reference case, Russia adds 18 gigawatts of nuclear capacity between 2005 and 2030, India 17 gigawatts, and China 45 gigawatts. Several OECD nations with existing nuclear programs also add new capacity in the reference case, including South Korea with 14 gigawatts, Japan with 11 gigawatts, and Canada with 6 gigawatts. In the United States, rules issued by the Internal Revenue Service in 2006 governing the production tax credit for new nuclear plants that was included in the Energy Policy Act of 2005 (EPACT2005), along with high fossil fuel prices, support the addition of 16.6 gigawatts of capacity at newly built nuclear power plants and 2.7 gigawatts expected from uprates of existing plants, while 4.5 gigawatts of existing capacity is expected to be retired. The use of hydroelectricity and other grid-connected renewable energy sources continues to expand in the reference case projection. With consumption projected to increase by an average of 2.1 percent per year from 2005 to 2030, renewable fuels are the fasting growing source of energy in the IEO2008 reference case. Higher fossil fuel prices, particularly for natural gas in the electric power sector, along with government policies and programs supporting renewable energy, allow renewable fuels to compete economically. Much of the growth in renewable energy consumption is projected to come from mid- to large-scale hydroelectric facilities in non-OECD Asia and Central and South America, where several countries have hydropower facilities either planned or under construction. In non-OECD Asia, China’s 18,200-megawatt Three Gorges Dam project is nearing completion at the end of 2008, and the China Yangtze River Three Gorges Project Development Corporation has already announced plans to increase its total installed capacity to 22,400 megawatts. In addition, work continues on the 12,600-megawatt Xiluodu project on the Jisha River (scheduled for completion in 2020 as part of a 14-facility hydropower development plan) and on the country’s third-largest hydroelectric facility, the 6,300-megawatt Longtan project on the Hongshui River [1]. In India, more than 14,500 megawatts of hydropower capacity currently is under construction [2]. Work has begun on what will be India’s largest hydroelectric facility to date, the 2,000-megawatt Lower Subansiri in Arunachal Pradesh [3]. In Central and South America, Brazil has plans for a number of new hydropower projects that the country hopes to complete in order to keep up with electricity demand after 2010, including the 3,150-megawatt Santo Antonio and 3,300-megawatt Jirau projects on the Rio Madeira River, along with the first phase of the 5,500-megawatt Belo Monte dam project on the Xingo River [4]. Outside of Canada and Turkey, hydropower capacity is not expected to grow substantially in the OECD nations, where most hydroelectric resources already have been developed or lie far from population centers. Instead, most of the increase in OECD renewable energy consumption is expected to come from nonhydroelectric resources, such as wind, solar, geothermal, municipal solid waste, and biomass. In 2007, installed wind power capacity in the United States increased by 4,287 megawatts (or 38 percent), supported by the Federal production tax credit and a number of renewable portfolio standards in individual States that encourage growth of renewable energy [5]. Wind energy markets have also grown strongly in non-OECD Asia, where China added more than 3,400 megawatts and India about 8,000 megawatts of new wind capacity in 2007 [6]. OECD Europe, where many countries are obligated to reduce greenhouse gas emissions under the Kyoto Protocol treaty, remains a key market for wind power, adding 8,554 megawatts of new capacity in 2007 alone. The European Union (EU) has set a target of increasing the renewable energy share to 20 percent of gross domestic energy consumption by 2020, including a mandatory minimum of 10 percent for biofuels [7]. Most EU member countries offer incentives for renewable energy production, including subsides and grants for capital investments and premium prices for generation from renewable sources. Installation of wind-powered generating capacity has been particularly successful in Germany and Spain, which had 22,247 megawatts and 15,145 megawatts of installed capacity, respectively, at the end of 2007 [8]. Delivered Energy Consumption by End-Use SectorUnderstanding patterns in the consumption of energy delivered to end users is an important part of developing projections of global energy use. Outside the transportation sector, which at present is dominated by liquid fuels and other petroleum products, the mix of energy use in the residential, commercial, and industrial sectors varies widely by region, depending on a combination of regional factors, such as the availability of energy resources, the level of economic development, and political, social, and demographic factors. Residential SectorEnergy use in the residential sector, which accounted for about 15 percent of worldwide delivered energy consumption in 2005, is defined as the energy consumed by households, excluding transportation uses. For residential buildings, the physical size of the structures is one key indicator of the amount of energy used by their occupants. Larger homes require more energy to provide heating, air conditioning, and lighting, and they tend to include more energy-using appliances, such as televisions and laundry equipment. Smaller structures require less energy, because they contain less space to be heated or cooled, produce less heat transfer with the outdoor environment, and typically have fewer occupants. For instance, residential energy consumption is lower in China, where the average residence currently has an estimated 300 square feet of living space or less per person, than in the United States, where the average residence has an estimated 680 square feet of living space per person [9]. The type and amount of energy used by households vary from country to country, depending on income levels, natural resources, climate, and available energy infrastructure. In general, typical households in the OECD use more energy than those in non-OECD nations, in part because higher income levels allow OECD households to purchase more energy-using equipment. In the United States, for example, GDP per capita in 2005 was about $37,000 (in real 2000 dollars per person) and residential energy use per capita was estimated at 38.7 million Btu. In contrast, China’s per-capita income in 2005, at $5,900, was only about one-sixth the U.S. level, and residential energy use per capita was 3.2 million Btu. Although the IEO2008 projections account for marketed energy use only, households in many non-OECD countries still rely heavily on traditional, non-marketed energy sources, including wood and waste, for heating and cooking. Much of Africa remains unconnected to a power grid; and in 2004, an estimated 93 percent of the rural inhabitants of sub-Saharan Africa used biomass as their primary fuel source for cooking [10]. Some areas of China and India also rely heavily on woodfuel, woodwaste, and charcoal for cooking. In China, about 55 percent of the rural population uses biomass for cooking, as does 87 percent of the rural population in India. Regional economic development should displace some of that use as incomes rise and marketed fuels, such as propane and electricity, become more widely accessible. Commercial SectorThe commercial sector—often referred to as the services sector or the services and institutional sector—consists of businesses, institutions, and organizations that provide services. The sector encompasses many different types of buildings and a wide range of activities and energy-related services. Examples of commercial sector facilities include schools, stores, correctional institutions, restaurants, hotels, hospitals, museums, office buildings, banks, and stadiums that hold sporting events. Most commercial energy use occurs in buildings or structures, supplying services such as space heating, water heating, lighting, cooking, and cooling. Energy consumed for services not associated with buildings, such as for traffic lights and city water and sewer services, is also categorized as commercial sector energy use. Economic trends and population growth drive commercial sector activity and the resulting energy use. The need for services (health, education, financial, government) increases as populations increase. The degree to which additional needs are met depends in large measure on economic resources—whether from domestic or foreign sources—and economic growth. Economic growth also determines the degree to which additional activities are offered and utilized in the commercial sector. Higher levels of economic activity and disposable income lead to increased demand for hotels and restaurants to meet business and leisure requirements; for office and retail space to house and service new and expanding businesses; and for cultural and leisure space such as theaters, galleries, and arenas. In the commercial sector, as in the residential sector, energy use per capita in the non-OECD countries is much lower than in the OECD. Non-OECD commercial energy consumption per capita averaged only 1.2 million Btu in 2005, compared with the OECD average of 16.4 million Btu. Slow population growth in most of the OECD nations contributes to slower anticipated rates of increase in the commercial energy demand. In addition, continued efficiency improvements are projected to moderate the growth of energy demand over time, as energy-using equipment is replaced with newer, more efficient stock. Conversely, strong economic growth is expected to include continued growth in business activity, with its associated energy use, in areas such as retail and wholesale trade and business, financial, and leisure services. The United States is the largest consumer of commercial delivered energy in the OECD and is expected to remain in that position throughout the projection period. U.S. commercial energy use accounts for about 45 percent of the OECD total through 2030. In the non-OECD nations, economic growth and commerce are expected to increase rapidly, fueling additional demand for energy in the service sectors. Faster population growth is also expected, relative to that in the OECD countries, portending increases in the need for education, health care, and social services and the energy required to provide them. The energy needed to fuel growth in commercial buildings will be substantial, with total delivered commercial energy use among the non-OECD nations expected to rise by 3.3 percent per year, faster than any other end-use sector. Meeting the fast-paced growth in demand for energy in the commercial sectors of non-OECD nations is likely to present a challenge. In China, for instance, a large number of existing commercial buildings are classified as “high energy-consuming,” with energy use per square foot at levels that are two or three times as high as those in the western world [11]. The country’s eleventh 5-year plan, for 2006-2010, included a goal to transform all existing buildings into “energy-saving” buildings by 2020 and required that all buildings constructed after 2005 incorporate natural ventilation, natural lighting, and other provisions aimed at reducing energy intensity. Industrial SectorEnergy is consumed in the industrial sector by a diverse group of industries—including manufacturing, agriculture, mining, and construction—and for a wide range of activities, such as process and assembly uses, space conditioning, and lighting. Inputs that typically are considered energy products are included in industrial sector energy use. For example, natural gas and petroleum products used as feedstocks to produce non-energy products, such as plastics, are counted as energy used in the industrial sector. Industrial sector energy demand varies across regions and countries of the world, based on level and mix of economic activity, technological development, and population, among other factors. The OECD economies generally have more energy-efficient industrial operations and a mix of industrial output that is more heavily weighted toward non-energy-intensive sectors than do the non-OECD countries. In the United States, for example, the manufacturing share of total economic output has declined steadily over the past two decades, while the output share for service industries (included in the commercial sector) has increased. Similar developments are expected for the other OECD economies, as increasing international trade fosters a shift toward a less energy-intensive mix of industrial activity. The non-OECD economies generally have higher industrial sector energy consumption relative to GDP than do the OECD countries. On average, the ratio is almost 40 percent higher in the non-OECD countries. In particular, Russia and the Eastern European countries still have energy-inefficient capital stock remaining from the days of central planning. For example, 85 percent of Russia’s cement production uses the “wet” process, which requires 70 percent more fuel than the “dry” method. In the United States, by comparison, less than 19 percent of the cement produced in 2003 was made using the wet process [12]. As inefficient facilities and production techniques in non-OECD Europe and Eurasia are replaced with modern ones, industrial energy intensity (industrial energy use per dollar of GDP) in the region is expected to decline rapidly. Some former Soviet Republics, such as Ukraine and Georgia, have reduced their energy intensity by at least 5.5 percent a year from 2000 to 2005, compared with an average annual decline of 1.2 percent in the OECD countries [13]. In the IEO2008 reference case, industrial energy intensity in non-OECD Europe and Eurasia is projected to decline by 3.0 percent per year between 2005 and 2030, compared with a worldwide average decline of 2.1 percent per year. China, India, and the other non-OECD Asian nations are expected to have the most rapid increases worldwide in industrial sector energy consumption over the projection period. Whereas the OECD economies have largely been moving away from heavy, energy-intensive industries (such as steel and cement) toward light manufacturing and service activities, energy-intensive heavy manufacturing is growing in many of the non-OECD countries. Currently, about 77 percent of the delivered energy use in China is attributed to the industrial sector. Although that share is expected to begin declining, even by 2030 the industrial sector accounts for 72 percent of China’s total delivered energy use. In India and the other non-OECD Asian economies, industrial sector energy use also remains high throughout the projection period, accounting for about 60 percent of total delivered energy use for non-OECD Asia through 2030. Transportation SectorEnergy use in the transportation sector includes the energy consumed in moving people and goods by road, rail, air, water, and pipeline. The road transport component includes light-duty vehicles, such as automobiles, sport utility vehicles, minivans, small trucks, and motorbikes, as well as heavy-duty vehicles, such as large trucks used for moving freight and buses for passenger travel. Growth in economic activity and population growth are the key factors that determine transportation sector energy demand. Economic growth spurs increased industrial output, which requires the movement of raw materials to manufacturing sites, as well as movement of manufactured goods to end users. A primary factor contributing to the expected increase in energy demand for transportation is steadily increasing demand for personal travel in both the non-OECD and OECD economies. Increases in urbanization and in personal incomes have contributed to increases in air travel and to increased motorization (more vehicles) in the growing economies. Modal shifts in the transport of goods are expected to result from continued economic growth in both OECD and non-OECD economies. For freight transportation, trucking is expected to lead the growth in demand for transportation fuels. In addition, as trade among countries increases, the volume of freight transported by air and marine vessels is expected to increase rapidly over the projection period. Chapter 6 includes a more extensive examination of the world’s transportation energy use. World Economic OutlookEconomic growth is among the most important factors to be considered in projecting changes in world energy consumption. In the IEO2008 projections, assumptions about regional economic growth—measured in terms of real GDP in 2000 U.S. dollars at purchasing power parity rates—underlie the projections of regional energy demand. The macroeconomic framework employed for the economic growth projections reflects the interaction of many important economic variables and underlying relationships, both in the short term and in the medium to long term. In the short term, the spending decisions made by households and businesses (the demand side) determine economic activity and thus the short-term economic outlook. Spending decisions, in turn, are influenced by current economic and financial conditions— for example, income, interest rates, and the price of goods to be purchased. Over the 2005 to 2030 period, the world’s real GDP growth on a purchasing power parity basis is projected to average 4.0 percent annually in the reference case (Table 2 and Figure 16). In the long term, it is the ability to produce goods and services (the supply side) that determines the growth potential of any country’s economy. Growth potential is influenced by population growth, labor force participation rates, capital accumulation, and productivity improvements. In addition, for the developing economies, progress in building human and physical capital infrastructures, establishing credible regulatory mechanisms to govern markets, and ensuring political stability play more important roles in determining their medium- to long-term growth potential. Annual growth in world GDP over the 25-year projection period is higher than the rate recorded over the past 25 years, mainly because the countries that are expected to see more rapid growth, such as China and India, make up an increasing share of world GDP. A number of the developing non-OECD nations have undertaken significant reforms over the past several years. Improved macroeconomic policies, trade liberalization, more flexible exchange rate regimes, and lower fiscal deficits have lowered their national inflation rates, reduced uncertainty, and improved their overall investment climates. More microeconomic structural reforms, such as privatization and regulatory reform, have also played key roles. In general, such reforms have resulted in growth rates that are above historical trends in many of the developing economies over the past 5 to 10 years. OECD EconomiesThe U.S. economy, after weakening substantially in 2001 and 2002, recovered rapidly in 2003 and from then until 2006 recorded robust growth despite sustained increases in energy prices. Since 2006, however, a downturn in the housing sector has been a major hindrance to economic growth. In the IEO2008 reference case, the U.S. economy is expected to recover by 2009 as fiscal and monetary stimuli boost domestic demand, and to stabilize at its long-term growth path by 2010. GDP in the United States is projected to grow by an average of 2.5 percent per year from 2005 to 2030—slower than the 3.1-percent annual average growth from 1980 to 2005, because of the retirement of the baby boom generation and the resultant slowing of labor force growth. Like the United States, Canada is expected to maintain healthy growth in productivity and standard of living. In 2006 and 2007, strong commodity and energy prices countered the weakening effect of appreciation in the Canadian dollar. Canada’s labor force growth is projected to slow in the medium to long term, however, as the country’s own baby boom generation retires. Canada’s overall economic growth is projected to fall from 3.1 percent per year in 2005 to averages of 2.6 percent per year from 2008 to 2015 and 2.2 percent per year from 2015 to 2030. Mexico’s real GDP is projected to grow by an average of 3.9 percent per year from 2005 to 2030. The country’s strong performance over the past 5 years has been the result of favorable developments in several areas. First, lower inflation has allowed the central bank to lower key policy rates, which has encouraged domestic demand through greater investment. Second, high oil prices continue to spur government spending, including investment in infrastructure projects. Third, remittances from Mexicans working abroad continue to grow rapidly, boosting domestic consumption. Finally, Mexico’s industrial production follows, and is heavily influenced by, U.S. GDP growth and outsourcing of employment. Global financial markets remain friendly to Mexico in terms of the availability and cost of credit and the volume of foreign direct investment. In general, strong trade ties with the United States are expected to help cushion Mexico from deeper economic troubles. By the same token, Mexico’s future growth is also more dependent on U.S. growth. The economy of OECD Europe grew by more than 3 percent in both 2006 and 2007; however, recent data provide mixed signals about its likely short-term performance. Recent turbulence in international financial markets and weaker growth in the United States are pointing to a likely slowdown to 2.7-percent growth in 2008. Over the long term, OECD Europe’s GDP growth is projected to average 2.3 percent per year from 2005 to 2030, in line with what OECD considers to be potential output growth in the region’s economies [14]. According to the International Monetary Fund, OECD Europe’s long-term growth prospects depend on its ability to accelerate improvements in labor productivity and employment growth and to improve structural flexibility in the various national economies [15]. After a decade of stagnation and several false starts, Japan’s economic growth has been relatively robust since 2003. Although it is low by the standards of pre-1990 Japan, the recent annual growth in GDP exceeds the potential (no more than 2 percent real growth) for a country with a declining labor force and population and an industrial technology that has already caught up with, and in some cases surpassed, the best elsewhere in the world [16]. With the continued decline in its labor force over the projection period, Japan’s annual GDP growth is projected to slow, averaging 1.4 percent from 2008 to 2015 and 0.7 percent from 2015 to 2030. In the short term, Japan’s highly skilled labor force and strong work ethic are expected to support the projected average growth rate, as more flexible labor policies allowing greater mobility for workers are adopted. Economic growth in the rest of OECD Asia is expected to be stronger than in Japan. In contrast to the GDP growth of 1.1 percent per year anticipated for Japan from 2005 to 2030 in the IEO2008 reference case, South Korea is projected to see average increases of 3.5 percent per year and Australia/New Zealand 3.0 percent per year. In the medium to long term, South Korea’s growth is projected to taper off and be sustained by productivity growth as the growth of its labor force slows. Prospects in both Australia and New Zealand are healthy, given their consistent track records of fiscal prudence and structural reforms aimed at maintaining competitive product markets and flexible labor markets. Non-OECD EconomiesOver the period from 2005 to 2030, economic growth in non-OECD Europe and Eurasia as a whole is projected to average 4.4 percent annually. For the past several years, the non-OECD nations of Europe and Eurasia have largely been sheltered from global economic uncertainties, recording strong economic growth in each year since 2000, primarily as a result of robust domestic demand, the growth bonus associated with ascension of some countries (including Estonia, Latvia, Lithuania, and Slovenia) to the European Union, and the impacts of rising oil prices on oil-exporting nations (including Russia, Kazakhstan, Azerbaijan, and Turkmenistan). High world oil prices have stimulated investment outlays, especially in the energy sector of the Caspian region; however, given the volatility of energy market prices, it is unlikely that the region’s economies will be able to sustain the growth rates recently achieved until diversification from energy becomes more broadly based. The long-term growth prospects for the former Soviet Republic economies of Eurasia hinge on their success in economic diversification, as well as further improvements in domestic financial and product markets. Much of the growth in world economic activity between 2005 and 2030 is expected to occur among the nations of non-OECD Asia, where regional GDP growth is projected to average 5.8 percent per year. China, non-OECD Asia’s largest economy, is expected to continue playing a major role on both the supply and demand sides of the global economy. IEO2008 projects an average annual growth rate of approximately 6.4 percent for China’s economy from 2005 to 2030—the highest among all the world’s economies. Structural issues that have implications for medium- to long-term growth in China include the pace of reform affecting inefficient state-owned companies and a banking system that is carrying a significant amount of nonperforming loans. In the IEO2008 reference case, development of domestic capital markets is expected to continue, providing macroeconomic stability and ensuring that China’s large savings are used more efficiently. India is another Asian country with a rapidly emerging economy. The medium-term prospects for India’s economy are positive, as it continues to privatize state enterprises and increasingly adopts free market policies. Average annual GDP growth in India over the 2005 to 2030 projection period is 5.8 percent. Accelerating structural reforms—including ending regulatory impediments to the consolidation of labor-intensive industries, labor market and bankruptcy reforms, and agricultural and trade liberalization—remain essential for stimulating potential growth and reducing poverty in the medium to long term. With its vast and relatively cheap English-speaking labor force, India is well positioned to reap the benefits of globalization. Except for China, direct exposure of non-OECD Asia’s financial institutions to mortgage-backed securities (or subprime risks) is limited. [17]. As a result, economic activity is expected to remain robust in the nations of non-OECD Asia. Effects of the recent turmoil in world financial centers are expected to be minimal for most of the non-OECD Asia economies. Over the medium term, from 2005 to 2015, national economic growth rates are expected to be roughly constant, before tapering off gradually to an average of 4.7 percent per year from 2015 to 2030 as labor force growth rates decline and economies mature. Rising oil production and prices have helped boost economic growth in the oil-exporting countries of the Middle East, many of which have also benefited from spillover effects on trade, tourism, and financial flows from the region’s oil exporters. In recent years, real GDP growth rates in the Middle East have averaged around 5 percent. Medium-term prospects for the region remain favorable, given that a significant portion of the recent increase in oil revenues is expected to continue throughout the projection period. Economic growth in Africa has maintained a healthy pace of more than 4 percent per year since 2000, based on increased earnings from fossil fuel exports, strong global demand and favorable international prices for some other export commodities, vigorous domestic demand, and significant foreign direct investment and foreign aid [18]. Africa’s combined economy is projected to grow at an average annual rate of 4.5 percent from 2005 to 2030—a projection that is optimistic by historical standards but is supported by the region’s strong economic activity over the past 5 years, resulting from expansion of primary exports and robust domestic demand in many of Africa’s national economies. Nevertheless, both economic and political factors—such as low savings and investment rates, lack of strong economic and political institutions, limited quantity and quality of infrastructure and human capital, negative perceptions on the part of international investors, protracted civil unrest and political disturbances, and especially the impact of HIV/AIDS on population growth—present formidable obstacles to growth in a number of African countries. Although the nations of Central and South America registered a combined 6-percent increase in GDP in 2004 (their best performance in 20 years), the region’s growth prospects have been hampered by a weak international credit environment, as well as domestic economic and/or political problems in a number of countries. With economic growth in Central and South America remaining heavily dependent on foreign capital flows, 3.9-percent average annual growth in GDP is projected from 2005 through 2030. Major Sources of Uncertainty in the ProjectionsAlternative Macroeconomic Growth CasesExpectations for the future rates of economic growth are a major source of uncertainty in the IEO2008 projections. To illustrate the uncertainties associated with economic growth trends, IEO2008 includes a high macroeconomic growth case and a low macroeconomic growth case in addition to the reference case. The two alternative growth cases use different assumptions about future economic growth paths, while maintaining the same relationship between changes in GDP and changes in energy consumption that is used in the reference case. In the high economic growth case, 0.5 percentage point is added to the growth rate assumed for each country or country grouping in the reference case. In the low economic growth case, 0.5 percentage point is subtracted from the reference case growth rate. The IEO2008 reference case shows total world energy consumption reaching 695 quadrillion Btu in 2030—286 quadrillion Btu in the OECD countries and 409 quadrillion Btu in the non-OECD countries. In the high growth case, world energy use in 2030 is projected to total 765 quadrillion Btu, or 70 quadrillion Btu (about 35 million barrels oil equivalent per day) higher than in the reference case. In the low growth case, world energy consumption in 2030 is projected to be 63 quadrillion Btu (32 million barrels oil equivalent per day) lower than in the reference case. Thus, the projections for 2030 in the high and low macroeconomic growth cases define a range of uncertainty equal to 113 quadrillion Btu (Figure 17). Alternative Price CasesThe impacts of energy prices on the level and composition of energy demand are another large source of uncertainty in the IEO2008 projections. To illustrate the impacts, IEO2008 includes two alternative price cases. In the IEO2008 high price case, world oil prices (in nominal terms) climb from $66 per barrel in 2006 to $186 per barrel in 2030; in the low price case, they decline to $46 per barrel in 2016 and increase slowly thereafter to $69 per barrel in 2030; and by comparison, in the reference case, they rise to $113 per barrel in 2030 (Figure 18). Despite the considerable difference between oil prices in the low and high price cases in 2030 (about $117 per barrel), the projections for total world energy consumption in the reference and alternative price cases do not vary substantially. There is, however, a larger impact on the energy mix. The projections for total world energy use in 2030 in the high and low price cases are separated by only 47 quadrillion Btu (Figure 19). In comparison, the difference between the low and high macroeconomic growth case projections is 113 quadrillion Btu. The potential effects of higher and lower oil prices on world GDP can also be seen in the low and high price cases. In the long run, the projections for economic growth are not affected substantially by the price assumptions. The most significant variations are GDP increases of around 1 percent in the low price case relative to the reference case in 2015 for some regions outside the Middle East and, in the oil-exporting Middle East region only, a 1-percent drop in GDP in 2015. In 2030, however, there are virtually no differences among GDP projections for any region in the different cases, because the world’s economies have had more time to adjust to the lower or higher prices. The most substantial impacts of the high and low price assumptions are on the mix of energy fuels consumed in each region, particularly liquids and coal (Figure 20). In the high price case, total world energy use in 2030 is about 27 quadrillion Btu lower, as is world liquids consumption, than projected in the reference case. Natural gas consumption is also lower in 2030, by a more modest 8 quadrillion Btu, whereas the projections for coal, nuclear power, and renewable energy consumption are higher than those in the reference case. In the low price case, lower prices both allow consumers to increase their use of liquids for transportation purposes and discourage the migration away from liquids to other energy sources in sectors where fuel substitution is fairly easy to achieve (as opposed to the transportation sector, where there are relatively few alternatives to liquid fuels). Total liquids consumption in 2030 is 20 quadrillion Btu higher in the low price case than projected in the reference case, reflecting increased demand in all the end-use sectors. The transportation sector shows the largest increase in liquids consumption (7 quadrillion Btu) in 2030 in the low world oil price relative to the reference case (Figure 21). In the IEO2008 reference case, world oil prices rise steadily after 2015, to $113 per barrel in 2030. As a result, liquids consumption is curtailed in countries that have other fuel options available—especially in the electric power sector, where coal and other fuels can be substituted. In the reference case, worldwide use of liquids for electricity generation falls by 2.3 quadrillion Btu from 2005 to 2030. In the low price case, consumption of liquids for electricity generation increases by 2.0 quadrillion Btu, as the non-OECD countries retain their oil-fired generating capacity in the lower price environment. Trends in Energy IntensityAnother major source of uncertainty in the projections is the changing relationship of energy use to GDP—or energy intensity—over time. Economic growth and energy demand are linked, but the strength of that link varies among regions. In the OECD nations, history shows the link to be a relatively weak one, with energy demand lagging behind economic growth (Figure 22). In the non-OECD nations, except for non-OECD Europe and Eurasia, economic growth has been closely correlated with energy demand growth for much of the past three decades (Figure 23). Historically, non-OECD Europe and Eurasia have had higher levels of energy intensity than either the OECD or other non-OECD economies. In non-OECD Europe and Eurasia, energy consumption generally grew more rapidly than GDP until 1990 (Figure 24), when the collapse of the Soviet Union created a situation in which both income and energy use declined but GDP fell more quickly. As a result, energy intensity increased. Only since the late 1990s, after the 1997 devaluation of the Russian ruble, did the Russian and Ukrainian industrial sectors begin to strengthen. Since then, economic growth in non-OECD Europe and Eurasia has begun to outpace growth in energy use significantly, and energy intensity has begun a precipitous decline. The region’s energy intensity is projected to continue declining in the IEO2008 reference case, while still remaining higher than in any other part of the world (Figure 25). The stage of economic development and the standard of living of individuals in a given region strongly influence the link between economic growth and energy demand. Advanced economies with high living standards have relatively high levels of energy use per capita, but they also tend to be economies where per-capita energy use is stable or changes very slowly. In the OECD economies, there is a high penetration rate of modern appliances and motorized personal transportation equipment. To the extent that spending is directed to energy-consuming goods, it involves more often than not purchases of new equipment to replace old capital stock. The new stock generally is more efficient than the equipment it replaces, resulting in a weaker link between income and energy demand in the future. The pace of improvement in energy intensity may change, given different assumptions of macroeconomic growth over time. Faster growth in income generally leads to a faster rate of improvement (decline) in energy intensity. In the IEO2008 high macroeconomic growth case, worldwide energy intensity is projected to decline by 2.3 percent per year on average from 2005 to 2030, as compared with 2.2 percent in the reference case. On the other hand, slower economic growth generally leads to a slower rate of improvement in energy intensity. In the low macroeconomic growth case, world energy intensity is projected to decline by an average of only 2.0 percent per year over the projection period. |

|